










IT Services Revenue per Employee Index
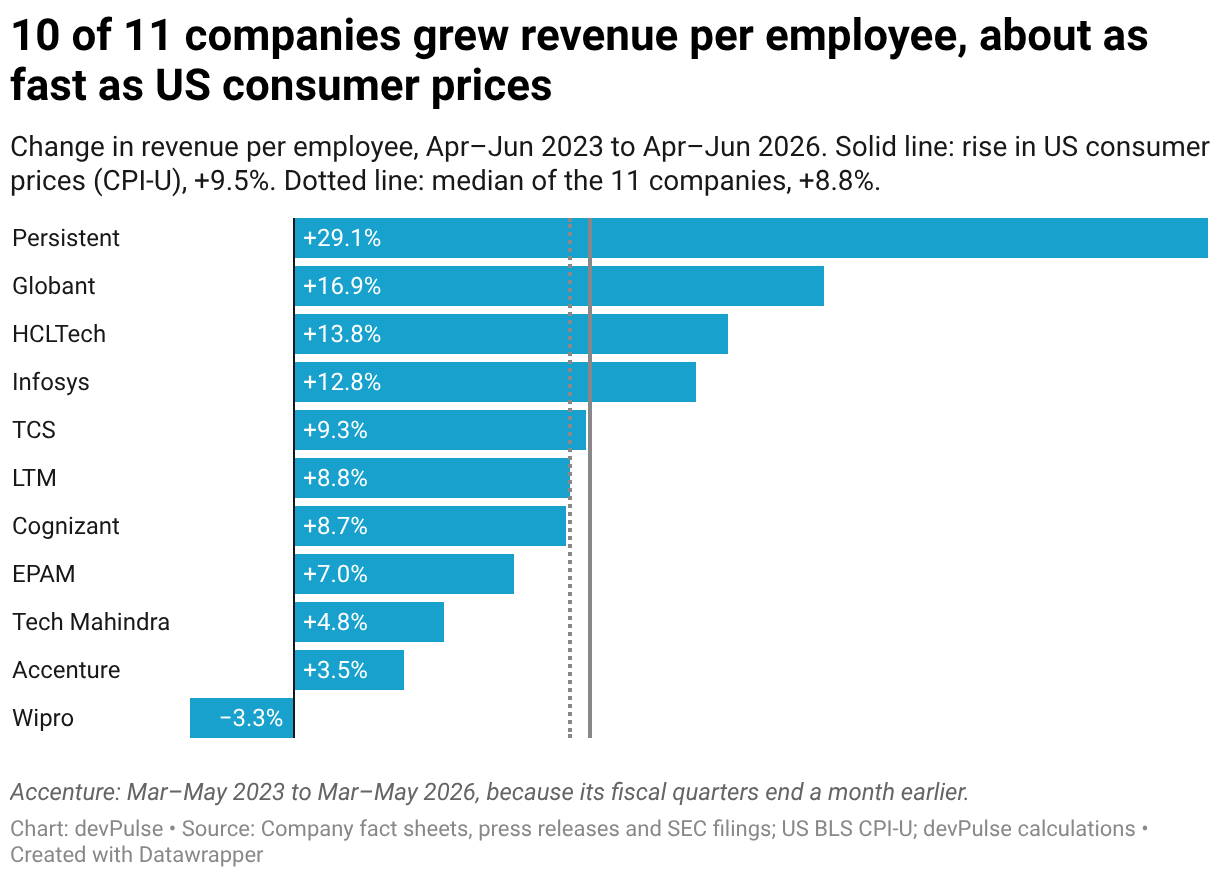
Revenue per employee rose at 10 of 11 listed IT services companies between Apr–Jun 2023 and Apr–Jun 2026. The median gain was 8.8%, close to the 9.5% rise in US consumer prices, and the gains came at different times, with no common jump.

The short answer
Three years of filings from 11 listed IT services companies show a modest, uneven rise in revenue per employee. It rose at 10 of the 11 between Apr–Jun 2023 and Apr–Jun 2026. At the typical company, the gain was 8.8%, close to the 9.5% rise in US consumer prices. The ten companies that report calendar quarters brought in 9.1% more revenue in Apr–Jun 2026 than three years earlier, with almost the same number of people.
The gains came at different times. Some companies grew revenue faster than staff; others cut staff. Over the past year, the three largest gains came at the three companies that reduced headcount.These numbers cannot show whether a company used AI, or where any savings from it went.
Key findings
- Between Apr–Jun 2023 and Apr–Jun 2026, revenue per employee rose at 10 of 11 listed IT services companies. The median gain was 8.8%; the range ran from +29.1% at Persistent to −3.3% at Wipro.
- US consumer prices rose 9.5% over the same period. For the ten companies that report calendar quarters, combined revenue per employee also rose 9.5%.
- The gains came at different times. Infosys, Persistent and HCLTech made most of theirs by Jul–Sep 2024. TCS, Tech Mahindra, Globant and Accenture made most of theirs in the latest four quarters.
- In the 12 months to June 30, 2026, three companies cut headcount: TCS (−19,271), Globant (−2,673) and Tech Mahindra (−1,757). The same three posted the largest gains in revenue per employee: +6.1%, +9.8% and +7.4%.
- The ten companies that report calendar quarters had 7,080 fewer employees in Apr–Jun 2026 than in Apr–Jun 2023. Their combined revenue rose 9.1%. Accenture, whose quarters end a month earlier, is not in these totals.
Why it matters
Analysts and the press describe "AI deflation" in IT services: if AI does part of the work, clients pay less for it. Kotak Institutional Equities, for example, expects Indian IT services revenue to deflate by 3–3.5% a year through FY2028 (as reported).
Revenue per employee alone cannot confirm or rule this out. If AI makes work cheaper, the savings can show up as lower prices, wider margins or smaller teams, and each moves this ratio differently, or not at all. What the filings do show is the pattern: across these 11 companies, revenue per employee rose roughly in line with US consumer prices, at different times, with no lasting common jump.
What would change this reading: several companies rising well above their past pace at the same time and staying ahead for a year or more. We check for it in every edition.
Revenue per employee, three-year change
Company fact sheets, press releases and SEC filings; US BLS CPI-U; devPulse calculations · Apr–Jun 2023 to Apr–Jun 2026
Each bar compares a company with its own past, so the chart shows change, not size. In dollars, Wipro's revenue per employee is about half of EPAM's.
At a glance
Change from Apr–Jun 2023 to Apr–Jun 2026, in the same order as the chart.
| Company | Revenue | Headcount | Revenue per employee | What changed |
|---|---|---|---|---|
| Persistent | +59.9% | +23.8% | +29.1% | Revenue grew more than twice as fast as headcount |
| Globant | +23.5% | +5.6% | +16.9% | Headcount fell 8.9% in the past year; revenue was flat |
| HCLTech | +14.1% | +0.2% | +13.8% | Revenue grew; headcount barely moved |
| Infosys | +10.1% | −2.4% | +12.8% | Most of the gain came by Jul–Sep 2024 |
| TCS | +5.5% | −3.5% | +9.3% | Headcount fell after the July 2025 restructuring |
| LTM | +15.6% | +6.2% | +8.8% | Steady rise, no large swings |
| Cognizant | +12.2% | +3.2% | +8.7% | Belcan purchase in Aug 2024; hiring since Jan–Mar 2025 |
| EPAM | +20.9% | +13.0% | +7.0% | Acquisitions in Oct–Dec 2024 broke the series |
| Tech Mahindra | +3.7% | −1.0% | +4.8% | All of the gain came in the past year |
| Accenture | +13.0% | +9.2% | +3.5% | Headcount grew nearly as fast as revenue (Mar–May quarters) |
| Wipro | −5.9% | −2.7% | −3.3% | Revenue fell faster than headcount |
When the gains came
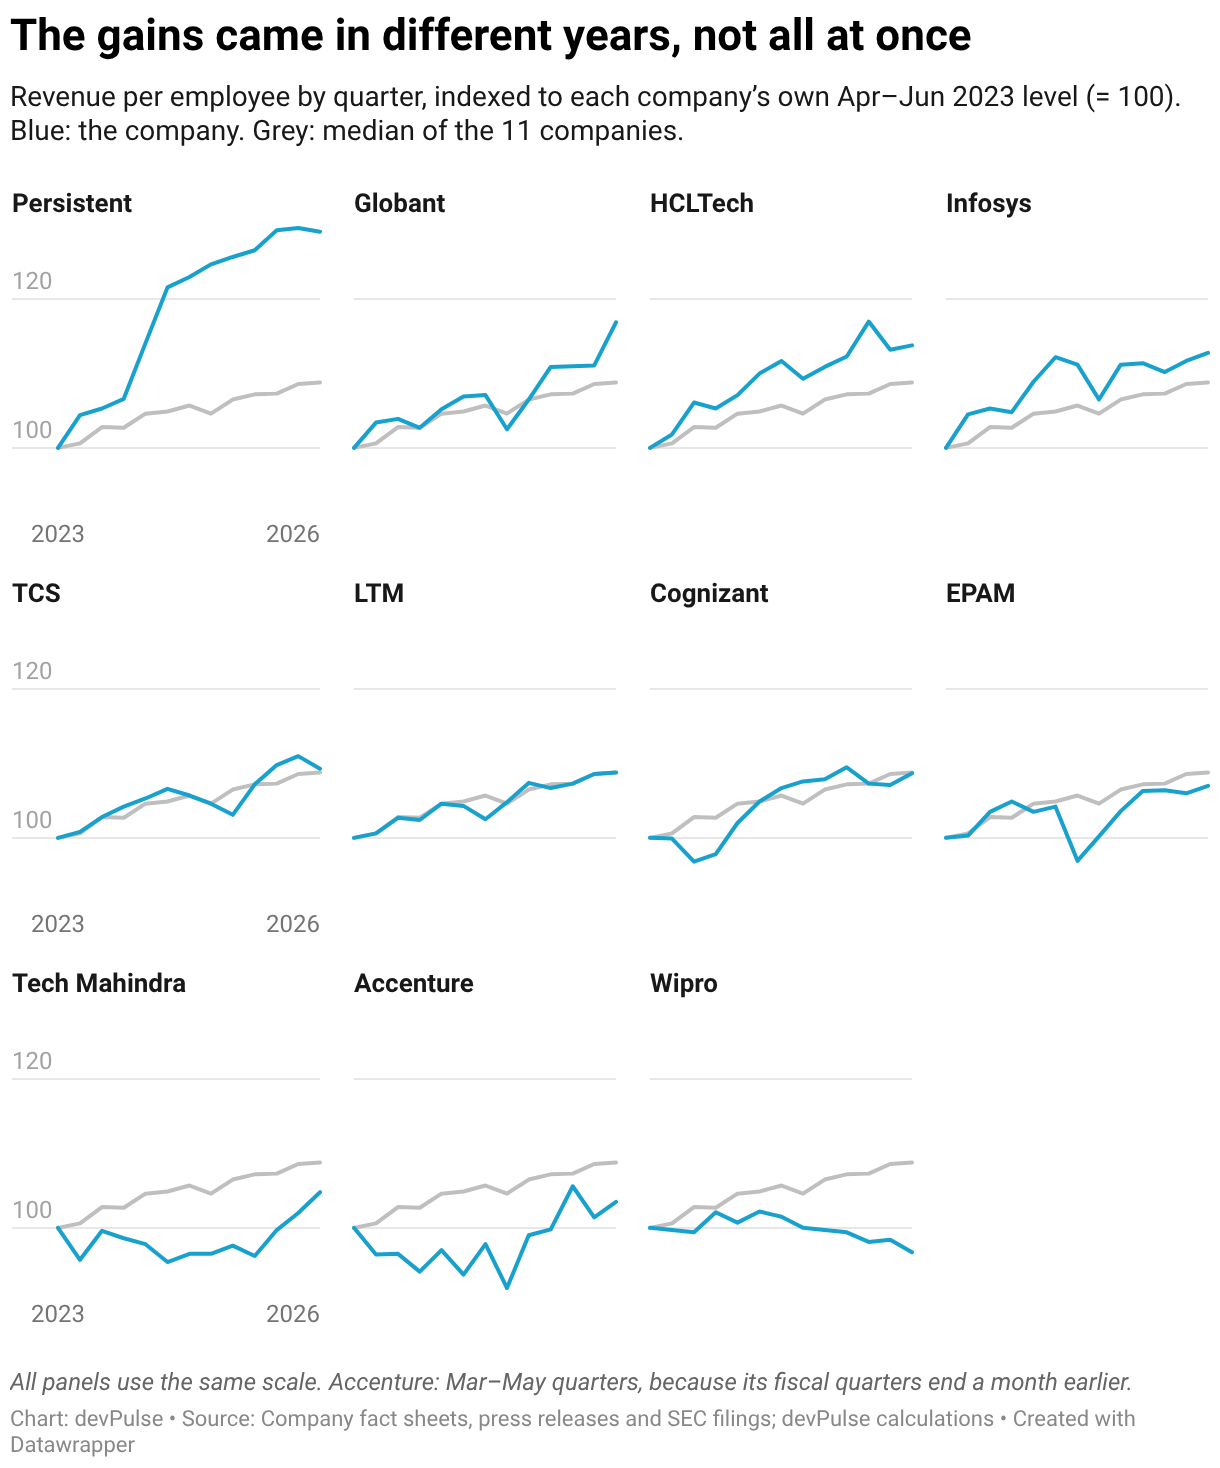
Company fact sheets, press releases and SEC filings; devPulse calculations · Apr–Jun 2023 to Apr–Jun 2026. Every panel uses the same scale, so the slopes can be compared. Infosys, Persistent and HCLTech rose early. TCS, Tech Mahindra and Globant rose late. Wipro drifted down. Some lines jump together in Apr–Jun after a weak Jan–Mar, as in 2024 and again in 2025. The pattern repeats from year to year, so it is not a shift: Infosys, Globant and Accenture gave most of the 2024 jump back by Jan–Mar 2025. The three-year comparison uses the same quarter at both ends, so the pattern does not affect it.
Headcount
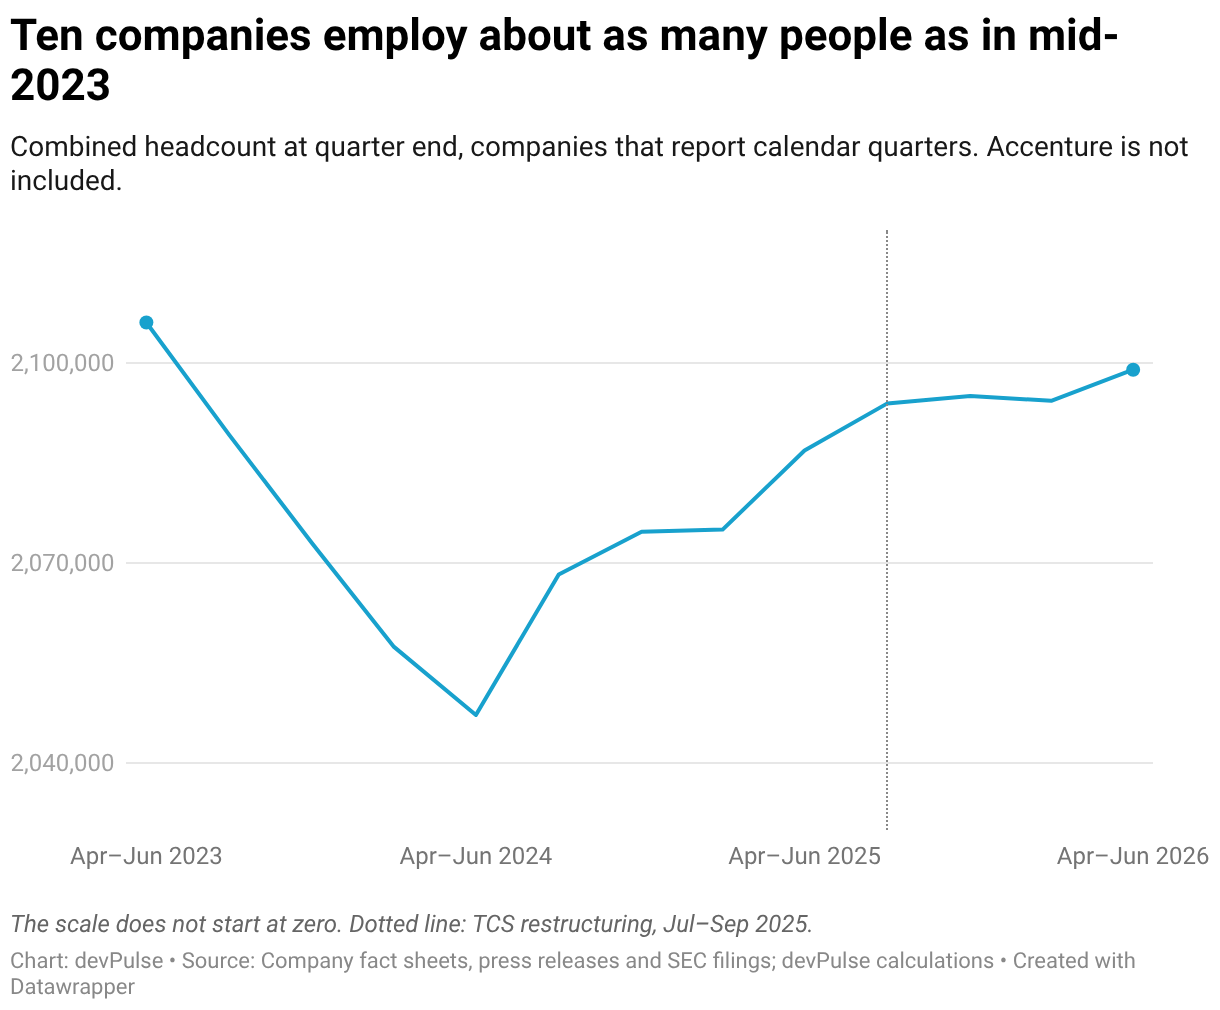
Company fact sheets, press releases and SEC filings; devPulse calculations · Apr–Jun 2023 to Apr–Jun 2026. Combined headcount at the ten companies fell by 58,863 by Apr–Jun 2024, well before TCS's 2025 restructuring. It has since recovered all but 7,080 of that.
By company
Accenture
Accenture's fiscal year ends August 31, so its quarters end a month earlier than the others: Mar–May instead of Apr–Jun. From Mar–May 2023 to Mar–May 2026, its revenue per employee rose 3.5%, the smallest gain among the ten that grew. Revenue rose 13.0%; headcount rose 9.2%, from about 732,000 to about 799,000.
Headcount peaked at about 801,000 in Dec–Feb 2025 and fell to about 779,000 by Jun–Aug 2025. In September 2025, Accenture reported costs for a business optimization program that included workforce exits (results). Its index dips every Dec–Feb, its seasonally weakest quarter.
Source: Accenture investor relations
Cognizant
Cognizant's revenue per employee rose 8.7%: revenue grew 12.2%, headcount 3.2%. Headcount fell by 9,300 in the year to Apr–Jun 2024, to 336,300.
In August 2024, Cognizant closed its purchase of Belcan, which has more than 6,500 engineers and technical consultants (announcement). Its headcount still rose only 3,800 that quarter. Since Jan–Mar 2025, Cognizant has added 20,400 people, and its index has stayed between 107 and 110.
Source: Cognizant investor relations
EPAM
EPAM's index rose to 104.9 by Jan–Mar 2024, dropped to 96.9 in Oct–Dec 2024 and recovered to 107.0 by Apr–Jun 2026.
The drop is a consolidation effect. That quarter, EPAM closed the purchases of NEORIS (about 4,800 professionals, Nov 1, 2024) and First Derivative (more than 1,800 employees, Dec 3, 2024). Their people counted in full at quarter end, their revenue only from the closing dates.Read the two segments separately: revenue per employee rose 4.2% from Apr–Jun 2023 to Jul–Sep 2024, and 6.7% from Jan–Mar 2025 to Apr–Jun 2026.
Source: EPAM investor relations
Globant
Globant's revenue per employee rose 16.9%, the second-largest gain. Most of it came in the past year, and from headcount: revenue was flat ($614.2 million in Apr–Jun 2025, $614.4 million in Apr–Jun 2026), while headcount fell 8.9%, from 30,084 to 27,411. Globant attributed the Apr–Jun 2025 decline to its Business Optimization Plan (results).
Before that, headcount grew from 25,947 to 31,280 by Oct–Dec 2024, partly through acquisitions such as Pentalog (about 1,300 people, announced May 2023).
Source: Globant investor relations
HCLTech
HCLTech's revenue per employee rose 13.8%, the third-largest gain. Revenue grew 14.1%, while headcount barely moved: 223,438 in Apr–Jun 2023, 223,889 in Apr–Jun 2026. In between, headcount fell by 8,080 in Apr–Jun 2024, its largest one-quarter drop in the period.
HCLTech's revenue includes HCLSoftware, a products business. Its revenue has peaked in Oct–Dec in each of the past three years, and so has its index (117.0 in Oct–Dec 2025).
Source: HCLTech investor relations
Infosys
Infosys made almost all of its gain by Jul–Sep 2024, when its index reached 112.2. Headcount fell from 336,294 to a low of 315,332 in Apr–Jun 2024, while revenue grew. Since then, the index has moved between 106.5 and 112.8, ending at 112.8. Headcount rose to 337,034 by Oct–Dec 2025, then fell by 8,440 in Jan–Mar 2026 (report).
Source: Infosys quarterly results
LTM
LTM, formerly LTIMindtree, shows the steadiest rise of the 11: its index climbed to 108.8, and no quarter moved it by more than 3 points. Revenue grew 15.6% and headcount 6.2%, from 82,738 to 87,886. LTIMindtree was formed in a merger completed in November 2022, before the period covered.
Source: LTM fact sheet, Apr–Jun 2026
Persistent
Persistent's revenue per employee rose the most: 29.1%, as revenue grew 59.9% and headcount 23.8%. The biggest rise came in Apr–Sep 2024, when the index went from 106.6 to 121.6 while headcount slightly fell. Since Oct–Dec 2025, the index has held near 129.
On Sept 17, 2026, Persistent completed the purchase of 83.25% of Nagarro, which has about 18,500 employees (report). Persistent's series will break in Jul–Sep 2026, as EPAM's did.
Source: Persistent quarterly results
Tech Mahindra
Tech Mahindra's index stayed below 100 from Jul–Sep 2023 to Oct–Dec 2025, with a low of 95.4 in Jul–Sep 2024. All of its 4.8% gain came in the past year: revenue rose 6.1%, from $1,564 million to $1,660 million, while headcount fell 1.2%.
About 44% of its staff work in business process services (BPS), not IT. BPS headcount has moved by as much as 6,763 people in one quarter.
TCS
TCS's index rose to 106.6 by Jul–Sep 2024, then slipped to 103.1 by Apr–Jun 2025 as revenue fell 3.2% while headcount held steady. It jumped to 107.2 in Jul–Sep 2025, when headcount fell by 19,755 in one quarter, and peaked at 111.0 in Jan–Mar 2026. In Apr–Jun 2026, headcount rose by 9,279 and the index eased to 109.3.
In July 2025, TCS said it would cut about 2% of its global workforce over fiscal 2026 as part of becoming a "Future-Ready organisation," which includes "deploying AI at scale for our clients and ourselves" (statement). CEO K. Krithivasan told Moneycontrol the cuts were not driven by AI productivity gains but by skill mismatches and staff the company had not been able to deploy (Business Today). Net headcount change combines hiring, exits and layoffs; TCS does not report the split.
Source: TCS investor relations
Wipro
Wipro is the only one of the 11 whose revenue per employee fell: its index ended at 96.7. IT Services revenue fell 5.9% over the period, while headcount fell 2.7%. Headcount dropped 6.3% in the first three quarters, then rose 3.8% from Jan–Mar 2024 to Apr–Jun 2026. Wipro also reports its fixed-price revenue share, which went from 59.7% to 53.6%.
Source: Wipro quarterly results
What we conclude
Three years of filings from these 11 companies support four observations.
- No common jump. Revenue per employee rose at 10 of 11 companies, roughly in line with US consumer prices: 8.8% at the median, 9.5% for the ten calendar-quarter companies combined.
- Different timing. Infosys, Persistent and HCLTech made most of their gains by Jul–Sep 2024. TCS, Tech Mahindra, Globant and Accenture made most of theirs in the latest four quarters.
- Recent gains mixed revenue and headcount. The three largest gains of the past year came at the three companies that cut staff, but the mix differed. At Globant, revenue was flat and headcount fell 8.9%. At TCS, revenue rose 2.7% and headcount fell 3.1%. At Tech Mahindra, revenue rose 6.1% and headcount fell 1.2%.
- Headcount is about where it was. The ten calendar-quarter companies employ 7,080 fewer people than in mid-2023, or 0.3%, on 9.1% more revenue.
These numbers describe revenue and headcount. They do not show whether a company used AI, or whether any savings went to clients, margins or staffing. The next edition, with Jul–Sep 2026 data, will show whether any company pulls ahead.
What this index does not show
The index tracks two published numbers. It does not explain them.
- Why a number moved. Where a company has explained a change, we quote it and link to the source. Otherwise, we do not attribute it.
- AI's effect on its own. Revenue per employee also moves with pricing, currency, the mix of onsite and offshore work, use of subcontractors, utilization and acquisitions.
- Real productivity. We compare with US consumer prices as a yardstick only. Most of these companies' costs are wages in India, which follow different inflation.
- Which company is more efficient. Companies count revenue and headcount differently, so each is compared only with its own past.
- Profitability. Revenue per employee says nothing about margins.
Methodology
Revenue per employee is quarterly revenue in US dollars divided by headcount at the end of the quarter. Each company is indexed to its own Apr–Jun 2023 value, so the index compares change, not size. The median is the middle value of the 11 companies in each quarter.
- Why this metric. All 11 companies publish both numbers every quarter, so anyone can repeat the calculation.
- Sources. Quarterly fact sheets, data sheets, press releases and SEC filings, linked under each company above. The CSV has a source link for every row.
- Quarters. We use calendar quarters. TCS, Infosys, Wipro, Persistent, HCLTech, Tech Mahindra and LTM run April–March fiscal years, so Apr–Jun 2026 is their Q1 FY27. EPAM, Cognizant and Globant report calendar quarters. Accenture's fiscal year ends August 31; we place its Mar–May quarter in the Apr–Jun row, and so on.
- Revenue. As reported in US dollars, per quarter, not annualized. For Wipro, IT Services segment revenue. HCLTech's revenue includes its software business; Tech Mahindra's includes business process services.
- Headcount. Closing headcount as reported, for the whole company. For EPAM, total headcount, not delivery staff only. For Globant, all employees, not only technology professionals. EPAM rounds to 50, Cognizant to 100, and Accenture reports an approximate figure, rounded to 1,000.
- Inflation. US consumer price index for all urban consumers (CPI-U), not seasonally adjusted: 305.109 in June 2023 and 333.952 in June 2026, a rise of 9.5% (BLS, June 2023; BLS, June 2026).
- Restatements. We use figures as first published and note revisions. In its Jul–Sep 2024 data sheet, Wipro revised headcount for Oct–Dec 2023, Jan–Mar 2024 and Apr–Jun 2024 by up to 1,480 people.
- Derived figures. Infosys's Jul–Sep 2023 revenue is full-year FY24 revenue minus the other three quarters; its Jul–Sep 2025 headcount is the prior quarter plus the reported net addition. Cognizant's Apr–Jun and Jul–Sep 2023 headcounts come from the year-on-year changes in its 2024 releases. Globant's Jan–Mar revenue is six-month revenue minus Apr–Jun.
- Breaks in the series. EPAM's Oct–Dec 2024 acquisitions added about 6,600 people at once. Cognizant's Belcan purchase (Jul–Sep 2024) added more than 6,500. Globant's 2023 acquisitions, including Pentalog, added people in Jul–Dec 2023. Persistent's Nagarro purchase will break its series from Jul–Sep 2026.
- Rounding. Index values are shown to one decimal place. Percentages are calculated from unrounded values.
- Company selection. The sample is chosen by the editors, not by a formal rule. We started from a list of 20 listed IT services companies and gave priority to the largest ones that publish quarterly revenue and quarter-end headcount for all 13 quarters. An acquisition is kept in the series when the break can be dated and described (EPAM, Cognizant, Globant). The results describe these 11 companies, not the whole industry. Left out:
- Coforge: its Encora acquisition, about 9,300 people, was consolidated in Apr–Jun 2026, the last quarter of the series.
- Tieto: sold its Tech Services business in 2025 and restated only its 2024 figures, so 2023 is on a different basis.
- Endava: its fiscal 2026 results, which include Apr–Jun 2026, are delayed by an accounting investigation.
- Nagarro: taken over by Persistent in September 2026 and being delisted.
- Happiest Minds: made several acquisitions during the period, including PureSoftware (about 1,200 people), and has agreed to merge with ITC Infotech.
- Birlasoft, Mastek, L&T Technology Services and Grid Dynamics: revenue of about $105–310 million a quarter in Apr–Jun 2026, against $450 million or more for every company included. Left for later editions.
- Median and aggregate. The median is the middle company, so each company counts equally. The aggregate divides the combined revenue of the ten calendar-quarter companies by their combined headcount, so larger companies count more. Accenture is left out of the aggregate because its quarters end a month earlier.
- Robustness checks. Average headcount (start and end of quarter) needs the prior quarter's figure, so both methods are compared on the same dates, Jul–Sep 2023 to Apr–Jun 2026. The median gain rounds to 8.4% with either quarter-end or average headcount, and 10 of 11 companies rise under both. Individual companies move by up to 5.4 points. Globant's gain falls from 13.1% to 7.7% because both ends of the comparison shift: its headcount grew during the base quarter (average 26,726 against 27,505 at quarter end) and fell during the last one (average 27,960.5 against 27,411). With four-quarter revenue divided by average quarter-end headcount (Apr 2023–Mar 2024 against Jul 2025–Jun 2026), the median gain is 7.2% and 10 of 11 companies rise. The overall pattern holds in the variants we tested.
Full data
Raw inputs by quarter. Accenture's rows are its own fiscal quarters, one month earlier (Mar–May 2023 in the Apr–Jun 2023 row, and so on). The CSV adds revenue per employee, the index and a source link for every row.
Revenue, $ million
| Quarter | TCS | Infosys | Wipro | EPAM | Persistent | Accenture | Cognizant | HCLTech | Tech Mahindra | LTM | Globant |
|---|---|---|---|---|---|---|---|---|---|---|---|
| Apr–Jun 2023 | 7,226 | 4,617 | 2,778.5 | 1,170.2 | 282.9 | 16,564.6 | 4,886 | 3,200 | 1,600.7 | 1,058.7 | 497.5 |
| Jul–Sep 2023 | 7,210 | 4,718 | 2,713.3 | 1,152.1 | 291.7 | 15,985.2 | 4,897 | 3,225 | 1,555.2 | 1,075.5 | 545.3 |
| Oct–Dec 2023 | 7,281 | 4,663 | 2,656.1 | 1,157.3 | 300.6 | 16,224.3 | 4,758 | 3,415 | 1,573.0 | 1,083.7 | 580.7 |
| Jan–Mar 2024 | 7,363 | 4,564 | 2,657.4 | 1,165.5 | 310.9 | 15,799.5 | 4,760 | 3,430 | 1,548.2 | 1,069.4 | 571.1 |
| Apr–Jun 2024 | 7,505 | 4,714 | 2,625.9 | 1,146.6 | 328.2 | 16,466.8 | 4,850 | 3,364 | 1,558.9 | 1,096.2 | 587.5 |
| Jul–Sep 2024 | 7,670 | 4,894 | 2,660.1 | 1,167.5 | 345.5 | 16,405.8 | 5,044 | 3,445 | 1,588.7 | 1,126.6 | 614.7 |
| Oct–Dec 2024 | 7,539 | 4,939 | 2,629.1 | 1,248.4 | 360.2 | 17,689.5 | 5,082 | 3,533 | 1,567.5 | 1,138.7 | 642.5 |
| Jan–Mar 2025 | 7,465 | 4,730 | 2,596.5 | 1,301.7 | 375.2 | 16,659.3 | 5,115 | 3,498 | 1,548.8 | 1,131.0 | 611.1 |
| Apr–Jun 2025 | 7,421 | 4,941 | 2,587.4 | 1,353.4 | 389.7 | 17,727.9 | 5,245 | 3,545 | 1,564.0 | 1,153.3 | 614.2 |
| Jul–Sep 2025 | 7,466 | 5,076 | 2,604.3 | 1,394.4 | 406.2 | 17,596.3 | 5,415 | 3,644 | 1,586.0 | 1,180.1 | 617.1 |
| Oct–Dec 2025 | 7,509 | 5,099 | 2,640.0 | 1,408.0 | 422.5 | 18,742.1 | 5,333 | 3,793 | 1,610.0 | 1,208.0 | 612.5 |
| Jan–Mar 2026 | 7,621 | 5,040 | 2,651.0 | 1,400.1 | 436.0 | 18,044.1 | 5,413 | 3,682 | 1,625.0 | 1,222.4 | 607.1 |
| Apr–Jun 2026 | 7,624 | 5,082 | 2,614.5 | 1,414.8 | 452.4 | 18,718.1 | 5,481 | 3,650 | 1,660.0 | 1,223.5 | 614.4 |
Headcount at quarter end
| Quarter | TCS | Infosys | Wipro | EPAM | Persistent | Accenture | Cognizant | HCLTech | Tech Mahindra | LTM | Globant |
|---|---|---|---|---|---|---|---|---|---|---|---|
| Apr–Jun 2023 | 615,318 | 336,294 | 249,758 | 55,600 | 23,130 | 732,000 | 345,600 | 223,438 | 148,297 | 82,738 | 25,947 |
| Jul–Sep 2023 | 608,985 | 328,764 | 244,707 | 54,600 | 22,842 | 733,000 | 346,600 | 221,139 | 150,604 | 83,532 | 27,505 |
| Oct–Dec 2023 | 603,305 | 322,663 | 240,234 | 53,150 | 23,336 | 743,000 | 347,700 | 224,756 | 146,250 | 82,471 | 29,150 |
| Jan–Mar 2024 | 601,546 | 317,240 | 234,054 | 52,800 | 23,850 | 742,000 | 344,400 | 227,481 | 145,455 | 81,650 | 28,991 |
| Apr–Jun 2024 | 606,998 | 315,332 | 234,391 | 52,650 | 23,519 | 750,000 | 336,300 | 219,401 | 147,620 | 81,934 | 29,112 |
| Jul–Sep 2024 | 612,724 | 317,788 | 233,889 | 53,250 | 23,237 | 774,000 | 340,100 | 218,621 | 154,273 | 84,438 | 29,998 |
| Oct–Dec 2024 | 607,354 | 323,379 | 232,732 | 61,200 | 23,941 | 799,000 | 336,800 | 220,755 | 150,488 | 86,800 | 31,280 |
| Jan–Mar 2025 | 607,979 | 323,578 | 233,346 | 61,700 | 24,594 | 801,000 | 336,300 | 223,420 | 148,731 | 84,307 | 31,102 |
| Apr–Jun 2025 | 613,069 | 323,788 | 233,232 | 62,050 | 25,340 | 791,000 | 343,800 | 223,151 | 148,517 | 83,889 | 30,084 |
| Jul–Sep 2025 | 593,314 | 331,991 | 235,492 | 62,350 | 26,224 | 779,000 | 349,800 | 226,640 | 152,714 | 86,447 | 29,020 |
| Oct–Dec 2025 | 582,163 | 337,034 | 242,021 | 62,850 | 26,711 | 784,000 | 351,600 | 226,379 | 149,616 | 87,958 | 28,773 |
| Jan–Mar 2026 | 584,519 | 328,594 | 242,156 | 62,750 | 27,502 | 786,000 | 357,600 | 227,181 | 147,623 | 87,950 | 28,510 |
| Apr–Jun 2026 | 593,798 | 328,062 | 243,044 | 62,850 | 28,640 | 799,000 | 356,700 | 223,889 | 146,760 | 87,886 | 27,411 |
Revenue is rounded to $0.1 million where the company reports more precision; the CSV keeps the full figures.
Want to know what AI could change in your delivery?
The index shows that revenue per employee has barely moved across the industry so far. Inside a single team, the picture can look very different. devPulse helps companies find where AI and automation can take over routine work, measure the effect on their own numbers, and build solutions that make it into production.